Sekta ya nishati ya jua ya paa la Australia inaendelea kung'aa huku data mpya kutoka kwa Opereta wa Soko la Nishati la Australia ikifichua kuwa pato la PV lililosambazwa kwenye gridi kuu lilifikia rekodi ya juu katika robo ya mwisho ya 2023.

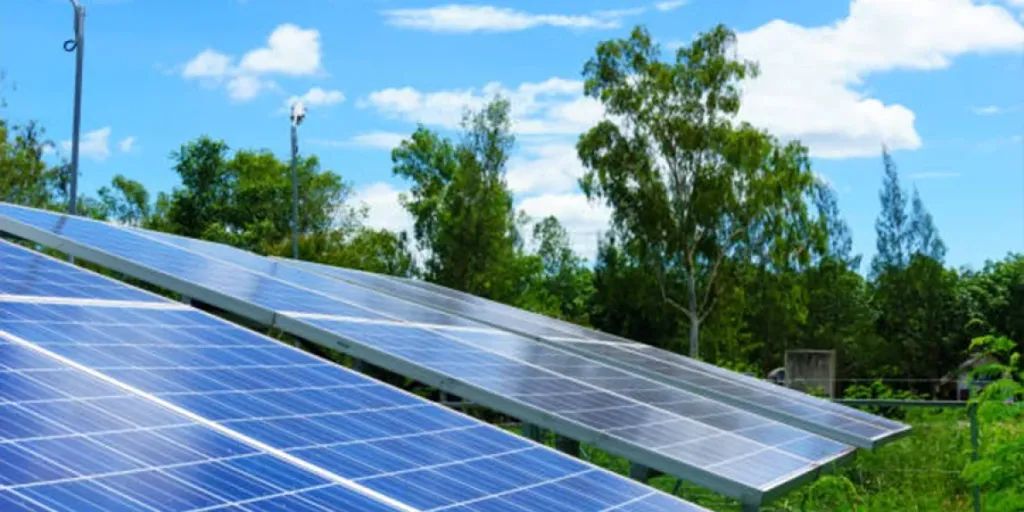
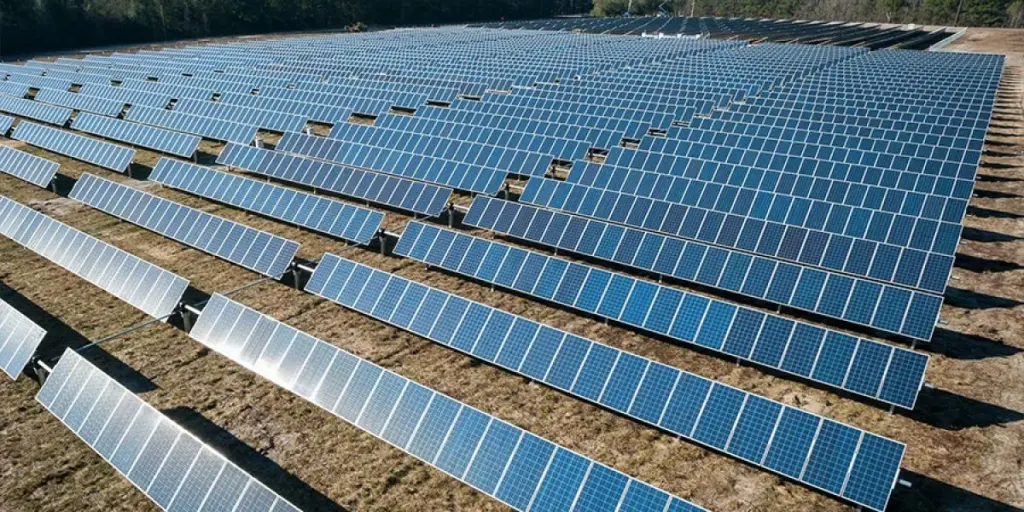
The Australian Energy Market Operator’s (AEMO) latest report shows that new records are rapidly being set for the amount of renewable energy, including grid-scale and rooftop solar, being fed into the National Electricity Market (NEM), reducing the reliance on traditional coal-fired generation.
AEMO Chief Executive Officer Daniel Westerman said there were moments in time in the final three months of 2023 that show just how fast Australia’s energy transition is happening.
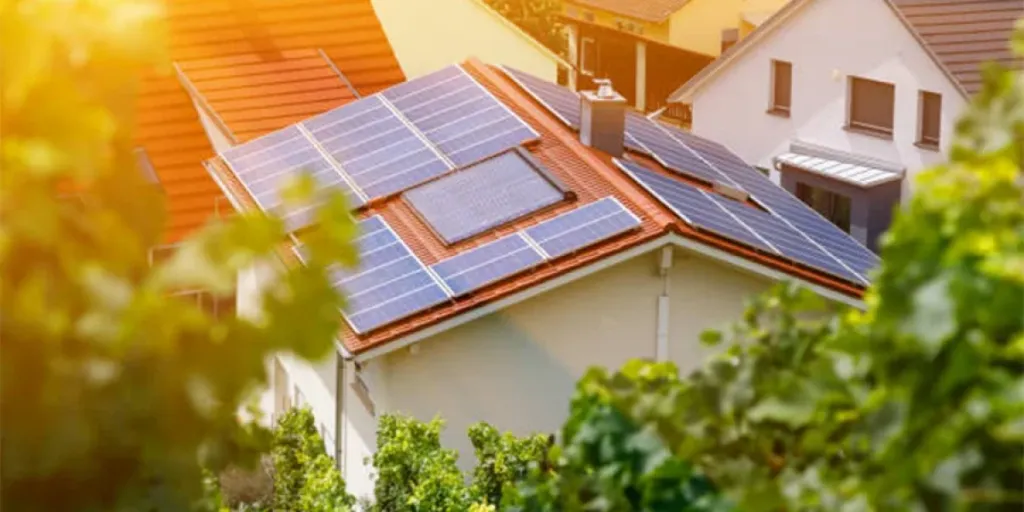
“Early in the afternoon of Dec. 31 rooftop solar met 101% of South Australia’s total electricity demand,” he said. “While on the afternoon of Oct. 24 rooftop solar and grid-scale renewables provided 72% of all electricity across the east coast. These events are snapshots of the transition that’s happening, and they are becoming more frequent. We are regularly seeing records set for the higher contribution of renewables, and lower levels of energy drawn from the grid because of rooftop solar.”
The latest Quarterly Energy Dynamics report shows that average distributed PV output reached an all-time high in Q4 2023 of 3,433 MW, 505 MW or 17% higher than the same period in 2022 and a new record for any quarter.
The market operator said distributed PV output reached record highs in all regions, with October yielding a particularly notable 44% year-on-year increase in monthly average for the NEM. By contrast, the NEM-wide November average rose only 7% year on year, with New South Wales and Queensland experiencing decreases on 2022 levels.
In December, this position reversed, with monthly averages falling in Victoria and South Australia within a 7% NEM-wide increase. At 17% for the fourth quarter as a whole, year-on-year growth of distributed PV output was lower than in recent quarters which had recorded annual growth rates of about 30%.
By region, New South Wales experienced a 20% increase in distributed PV output, reaching a quarterly average of 1,155 MW, while Queensland saw an 18% rise to average 1,063 MW.

Ili kuendelea kusoma, tafadhali tembelea yetu gazeti la pv Australia tovuti.
Maudhui haya yanalindwa na hakimiliki na huenda yasitumike tena. Ikiwa ungependa kushirikiana nasi na ungependa kutumia tena baadhi ya maudhui yetu, tafadhali wasiliana na: editors@pv-magazine.com.
Chanzo kutoka gazeti la pv
Kanusho: Maelezo yaliyoelezwa hapo juu yametolewa na pv-magazine.com bila ya Cooig.com. Cooig.com haitoi uwakilishi na dhamana kuhusu ubora na uaminifu wa muuzaji na bidhaa.